Every branch,
on one screen.
A dashboard you arrange yourself, and 270+ reports across every location, from Location Leaderboard and Location P&L to Dead Stock and Supplier Scorecard.
Your whole business,
at a glance.
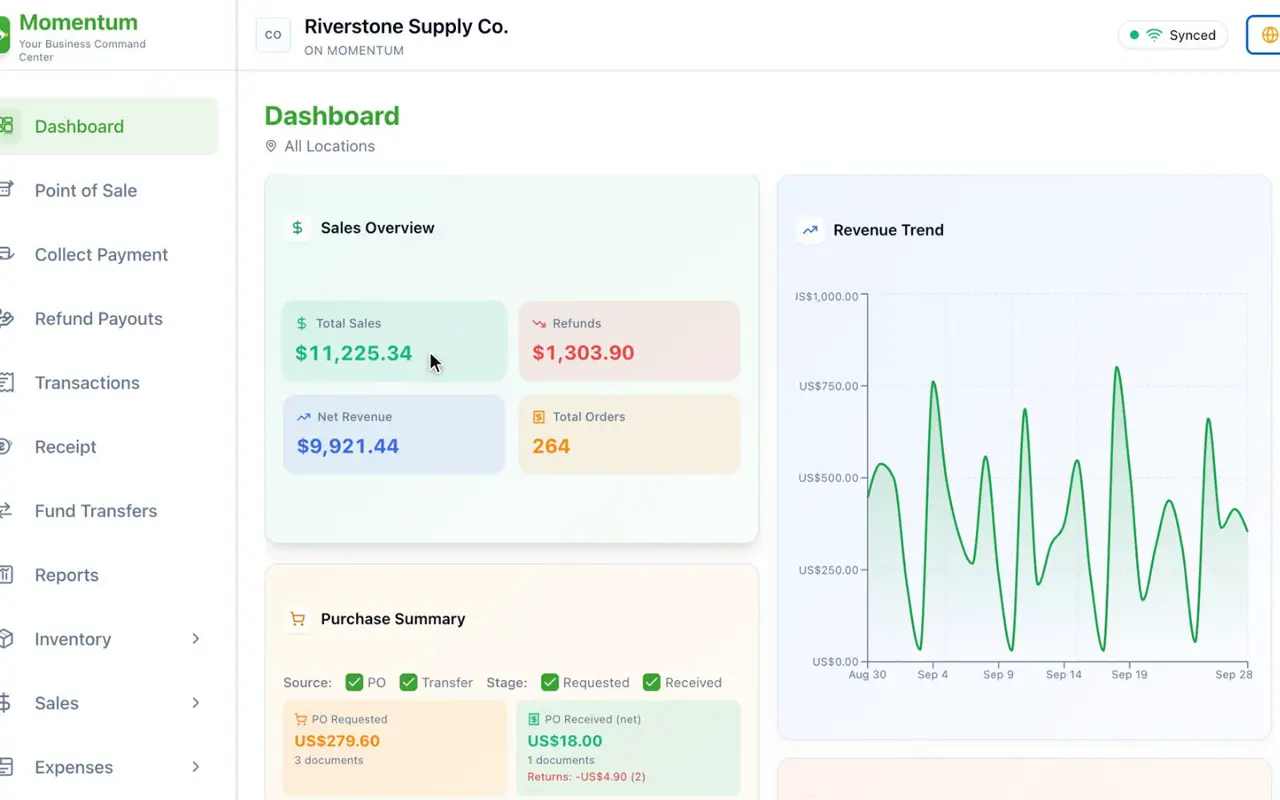
Put the numbers you check every morning where you want them.
Leaderboard and P&L by location, without exporting anything.
Across sales, stock, purchasing, customers and accounting.
See which branch
is pulling ahead.
The Location Leaderboard ranks every store and warehouse on the same measures, and Location P&L puts each one's sales and expenses side by side.
- Location Leaderboard and Location P&L
- The same measures for every location
- Dead Stock shows what isn't moving
270+ reports.
Ready to run.
Sales, stock, purchasing, customer and accounting reports are built in, so the answer to most questions is already there.
- 270+ reports built in
- Location P&L, Dead Stock, Supplier Scorecard and more
- Covering sales, stock, purchasing, customers and books
Ask a question,
see the records behind it.
Optional, and off until you switch it on. Ask about your business in plain words, and the answer links to the records it came from. It suggests; you decide what to do.
- Off by default; you switch it on
- Answers link to the records behind them
- It suggests; you decide
The numbers that run
a multi-store business.
Arranged the way you work, with the numbers you check first.
Combine sales, stock and purchasing in one report, group it the way you think, and save it.
Sales and expenses for every store and warehouse, side by side.
The cost at risk from expiry, branch by branch.
The rest of the platform
See your branches
side by side.
Book a walkthrough and we'll open the leaderboard, the P&L and the reports you'd use first.
- 1The Location Leaderboard
- 2Location P&L across every branch
- 3Momentum AI answering with linked records